RidgeBot® is driven by a powerful brain that contains artificial intelligence algorithms coupled with an expert knowledge base that guides it through vulnerability detection and testing to identify potential weaknesses in a network before the bad guys do. It launches iterative attacks based on perpetual learnings, leading to more comprehensive testing coverage with deeper and deeper inspection and insights.
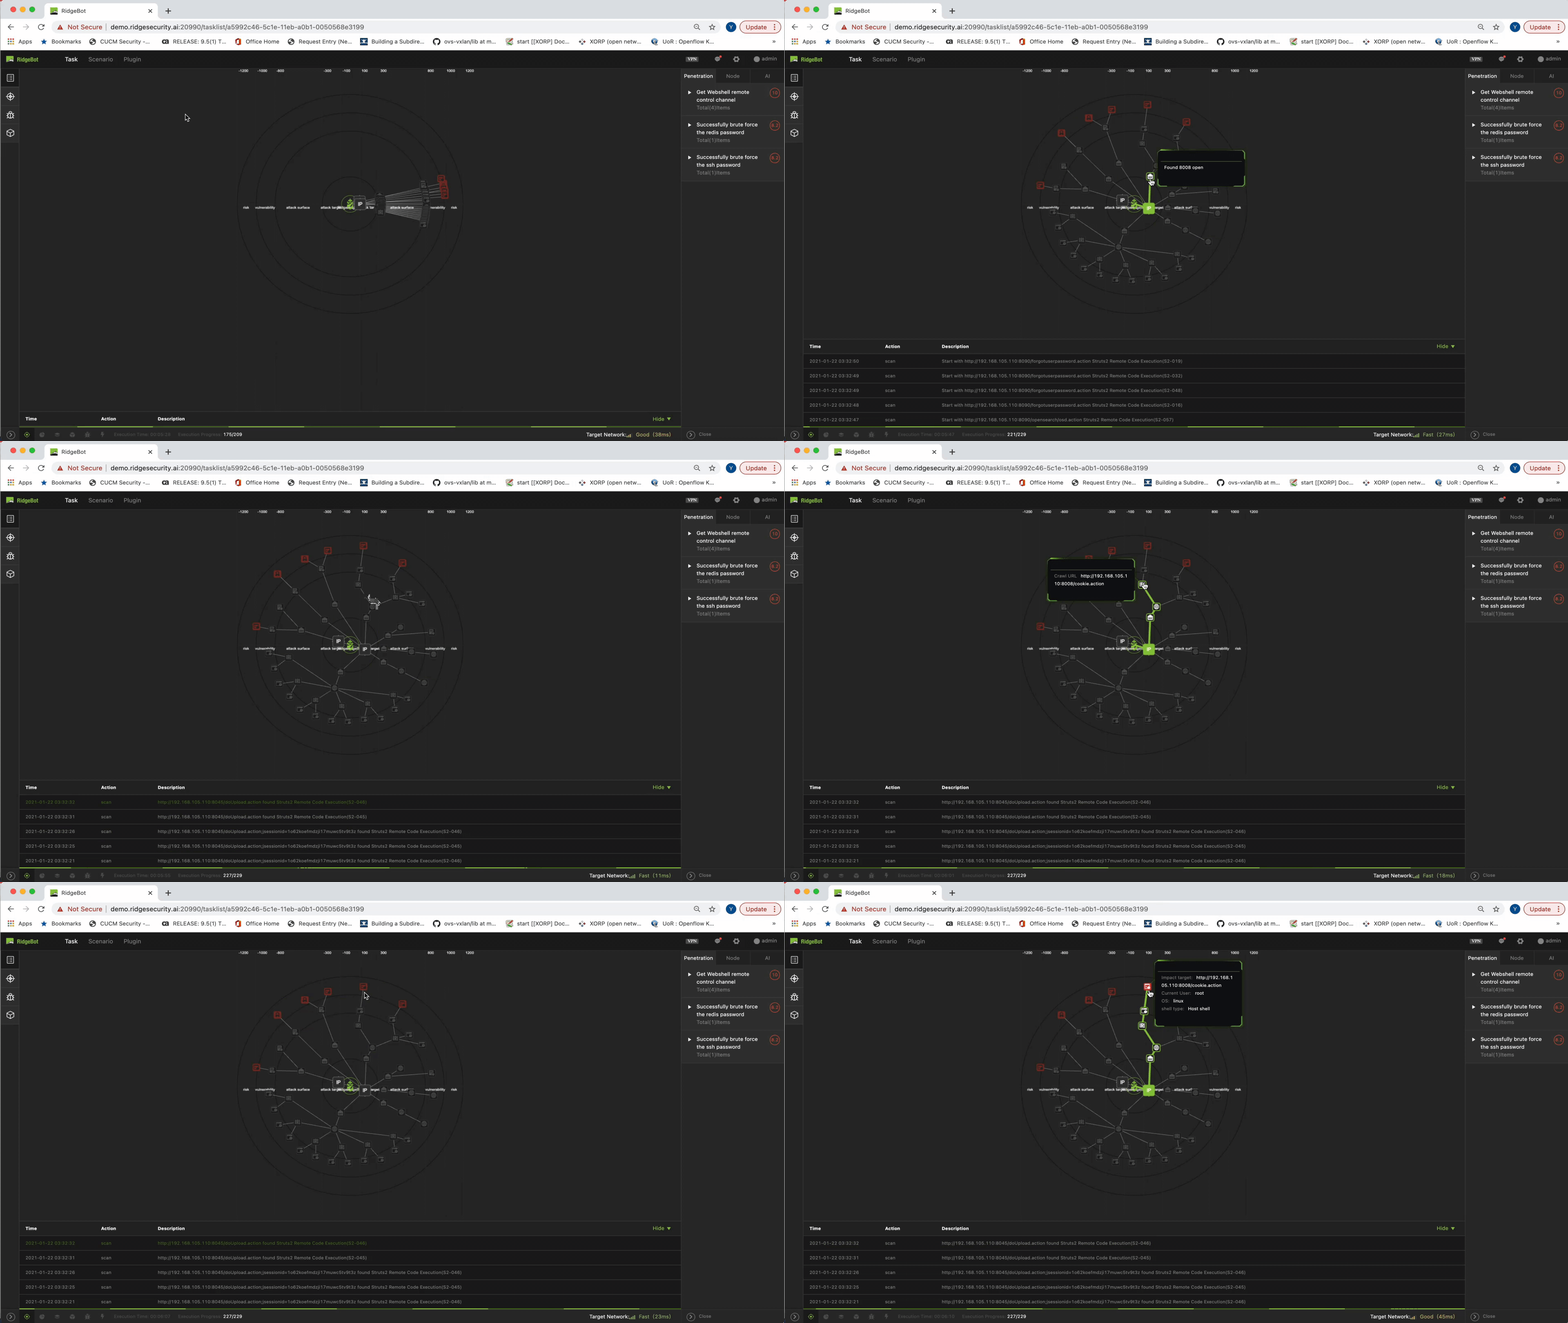
One of the prominent tools that directly helps admins get rapid and actionable insights into the attack surface and vulnerability details is the Topology feature of the UI. This feature automatically generates a topology map for each target, visualizing the data collected during the attack — including where the attack originated and the attack path — and labels the risks identified in each part of the topology. This vital tool helps admins home in on prioritized risks, and perform timely analysis, evaluation and action.

By clicking on a specific penetration test (task), admins get a topology view. The topology is a 5-layer mapping of the connection and derivative relationships of the 5 layers for each target:
- Target IP
- Open ports
- Attack surfaces
- Vulnerabilities
- Risks
Each of the five layers of data is represented by a circle or a ring. You can drill down to the risk to see the detailed attack path of each attack, trace the origins of the risk:
- The Topology map starts from the RidgeBot agent in the center
- Next, it visualizes the target machine (IP address or FQDN specified) as the first circle
- Then, it shows any attack surface discovered by RidgeBot. This is typically services with open ports, weak links that are URLs with logins, suspicious file uploads, parameter inputs, etc.
- The next layer illustrates the vulnerabilities – the result of the RidgeBot’s deep inspection of each attack surface
- The last circle illustrates the exploits, or what we call risks: the successful exploitation of the discovered vulnerabilities.
To get an indication of the security posture of the network, we show the ratio of number of attack surfaces over the number of vulnerabilities, and the ratio of the number of vulnerabilities over the number of exploits.
Another key element is exposing the attack path. Admins get a clear view of the process of how a vulnerability is discovered and exploited. This visualized sequence of the attack is critical in helping admins produce a proper mitigation plan.
The Topology feature is a key element shifting from manual-based, labor-intensive testing to machine-assisted automation, allowing security experts to forego daily labor-intensive tasks and focus their attention on researching new threats and new technologies.
